|
Binary Symmetry | |
| by MC Hess, visual
designer
| |
|
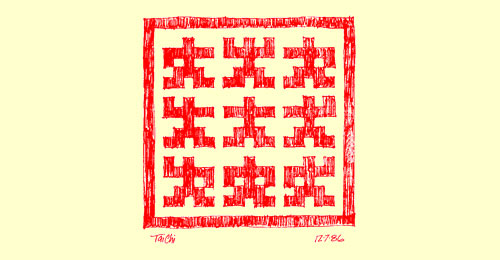
My interest in this subject extends from daily experiences with geometry and typography over a 35-year career of visual design. The terminology is personal and was created as needed. 5 x 5 ? In late 1986, while sketching on a quadrille pad, I generated this little drawing and asked myself a seemingly simple question: How many different 5x5 images will nature allow? After filling pages of quadrille pad I realized that imagination alone wasn't up to the task (not an easy thing for an artist to accept). I next made a 20-foot-wide wallchart and kept searching for a method to generate quantities of these symbols. |
 |
|
Invalid Ordering | |
|
Over several years I worked on the 5x5 problem in my spare time. It soon became my favorite intellectual diversion. I thought of it as some kind of hyper-digital I Ching. I thought of it as my Glass Bead Game. I identified all the expressions possible on a five-unit horizontal line. The first image to the right shows the initial ordering system. Though an invalid approach, this ordering system produced some interesting results, such as the middle image on the right, which shows repetitive patterning in widths 1, 3, 5, and 7. The final image on the right, titled Odd Growth, shows remarkable pattern repetition. It is composed of the symmetric elements for (odd) widths 1 through 13. This image was the first to display what I came to call Completion. Imagine folding the image at the center (a near ratio actually); the positive image above completely covers the negative below. This concept of Completion grew as the project progressed. These stacked-element images are called Signatures. |
 |
|
Valid Ordering | |
|
The ordering method I had been using did not produce the beautiful results hoped for. The method was problematic rather than problem solving. Finally, in 1996 I had an insight. Everything fell together and I was able to produce most of the images shown here in just a weekend. The insight of course was the relationship between my ordering problem and binary numbers. (Some newly acquired computer skills helped.) Because there are so many possible combinations of the 32 elements, I decided to look at the limited set of symmetric elements shown in red on the right. This limitation allowed me to inspect 16,807 examples in the 7 Generation charts (see further on), where each 5x5 symbol is constructed entirely from symmetric elements. This red symbol is termed an Icon. |
 |
|
Text | |
|
I was struck by the reflective symmetry within this chart, delineated by the descending diagonal indicated in red. |
 |
|
Implied Subtext | |
|
Implied
This Subtext set is the 3x5 implied counterpart of the Text set shown above. However, there are 7 (natural) Subtext sets. The first horizontal grouping in the chart at right is the first row of the Subtext 1 chart (shown further on); the second row is the second row of the Subtext 2 chart, and so on. |
 |
|
Implied Primes | |
|
When the Text and Subtext components that have an implied relationship are combined, the resulting images are Primes. The radial Primes are shown in red. |
 |
|
Subtext | |
|
There is no reflection in the following seven Subtext charts, which are a repetition of the Text set but with one of the symmetric elements in the top position. This top line of the Subtext is the ruling line of the symbol and lies at the center of Text/Subtext composites. This concept led to a deeper understanding of a center line (division) and two fields or sets. This is expressed both in the individual symbols and in the diagonal reflection evident in the Generation charts. | |
|
Subtext 1 | |
 | |
|
Subtext 2 | |
 | |
|
Subtext 3 | |
 | |
|
Subtext 4 | |
 | |
|
Subtext 5 | |
 | |
|
Subtext 6 | |
 | |
|
Subtext 7 | |
 | |
|
Primes | |
|
Primes are the spine (descending diagonal) of all the Generation charts (shown further on). These sets contain 90º rotation examples as well as radial singularities, which are indicated in red. | |
|
Primes 1 | |
 | |
|
Primes 2 | |
 | |
|
Primes 3 | |
 | |
|
Primes 4 | |
 | |
|
Primes 5 | |
 | |
|
Primes 6 | |
 | |
|
Primes 7 | |
 | |
|
Generation | |
|
Working in Photoshop, in bitmap mode and 72dpi, I placed all the text elements across the top of the chart, and one of the seven Subtext sets down the side for each chart generated. Selecting, copying, step-and-repeat from the top down and left to right constructs the full range of possibilities. Once again the reflection across the diagonal is plainly evident. | |
|
Generation 1 | |
 | |
|
Generation 2 | |
 | |
|
Generation 3 | |
 | |
|
Generation 4 | |
 | |
|
Generation 5 | |
 | |
|
Generation 6 | |
 | |
|
Generation 7 | |
 | |
|
Imagination | |
|
The images above are but a snapshot of far larger (imaginary) charts composed of all 31 visible and one invisible, for a total of 32 elements. Such charts would be nearly 8 feet on a side at 72dpi in one-point resolution (given that each symbol naturally rests upon a 7x7 tile and given that each chart will be 1024x1024 symbols plus one more for generation is 7x1025=7175 pixels). Since I don't have acces to a printer that size, and because one-point resolution (the charts above are 2-point resolution) would require a photo loop to read, I haven't produced those 32 charts. It would be interesting, however, to color code the various categories in such charts and observe the resulting patterns. (6.14Mb bitmap, 147.3 Mb rgb, 196.4 Mb cmyk) | |
|
Classification | |
|
The generation charts shown above were originally produced in bitmap mode. Once the variety was revealed, I arrived at the simple classification shown at right. 1 too massive, (Of course there are combinations of two or more categories that I ignored, but might look into later.) I colored the charts above, removed all the gray, slid the black together, and made the gleaned charts below to reveal those category 4 sets that had inspired me in the first place. |
 |
|
Gleans | |
|
The original motivation for this project was the promise of inspecting all the available one-stroke, letter-like symbols. The visual power of these reduced charts arises from both the symbolic nature of the images and the stark presentation of reflection that they portray. On some of these charts I included floaters so as to fill in and make the chart larger and more interesting. | |
|
Glean 1 | |
 | |
|
Glean 2 | |
 | |
|
Glean 3 | |
 | |
|
Glean 4 | |
 | |
|
Glean 5 | |
 | |
|
Glean 6 | |
 | |
|
Glean 7 | |
 | |
|
Completion | |
|
It is clear that almost 98% of 5x5 symmetry is composed of (180º) reflective pairs like the black symbols in the Glean 7 chart above. What remains are the 343 Primes that define the descending red diagonals. Most are (90º) rotational pairs; those symbols that possess full rotational symmetry are pairless. The idea of Completion led to a recognition of the special nature of these (pairless) singularities. Completion is what I term the pairing of the positive and negative image for any given pattern. This chart shows 32 radial Completion pairs and is organized to reveal the structural relationships among the pairs of pairs it displays. |
 |
|
512 Permutations of 3 x 3 | |
|
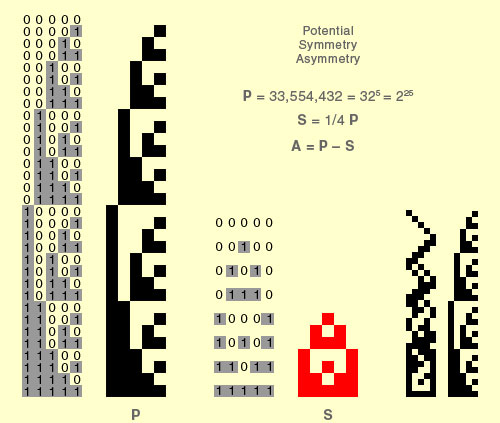
At 512 permutations, this 3x3 project had a more discreet path and required comparatively little time. In addition, this exercise allowed me to look at both the symmetric and asymmetric elements and is small enough to include the line of all zeros in its construction. The diagonal reflection explained above is evident in these charts. But something more is clear. The miniscule potential of 3x3 gives little notice of the veritable explosion of potential at 5x5. This suggests evidence of an irreducible complexity at 5x5. The relationship between the patterns presented here and the digital patterns that have become, over the previous two decades, the defining paradigm of our age is also worth noting. |
 |
|
3 x 3 Completion Pairs | |
|
The concept of Completion is fully tested in the following chart. With all 512 permutations of 3x3, 256 Completion pairs resulted. Each pair is assembled beginning at the front of the first chart (above) and the end of the last chart, and peals off in sequence as intuited. | |
 | |
|
An Interesting Question | |
|
As I was finishing up the 3x3 charts, I created the image at right. It is composed of the 3x3 radial Completion pairs, which are arranged to reflect across the chart. The question that nags me is, what (if anything) occupies that center square? |
 |
|
Perception | |
|
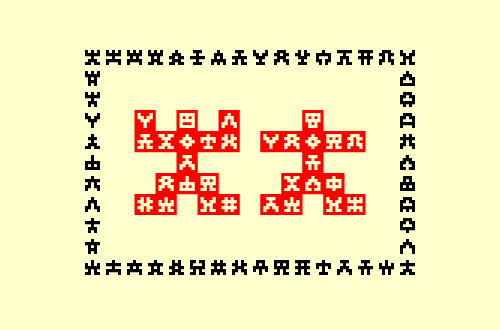
Both the Christian cross and the swastika are extant in the permutations of 5x5. Moreover, many symbols of ancient origin and meaning seem evident as well. There appears to be a very fundamental pattern recognition tropism at work. And yet, when put to close examination, few specific examples can be found in any cultural context. This vague familiarity and lack of specificity point to a fundamental, perhaps hard-wired, pattern recognition. As part of nature's allowance, we humans are likely subject to the same compelling efficiencies as our host. Human ideation seems to resonate in some primitive way with these simple (yet complex) potentials. This resonance may in part explain my compulsion to create, inspect, and play with these images for the past two decades. |
 |
|
Mark Hess | |
|
Mark Hess is a self-employed visual designer now living in Trinidad, Colorado after 30 years in Denver. He can be contacted at: An abbreviated version of this presentation is available at: |
 |
|
All text and images © HessArts 2006, not to be reproduced without the author's written consent. | |
